The failed cells also enter a thermal runaway state; However, a battery equipped with six battery surface temperature sensors showed a temperature drop when the gas was released for the second time.
Lithium Power News: Earlier this year, " new energy vehicles, power storage battery recycling use Interim Measures," the introduction to the discussion for a long time has been no significant progress in the use of industry bring good echelon. Many people think that the use of the ladder is promising, but where is the bottleneck? In addition to policies and business models, security and technology are definitely a more critical part. Even the best business opportunities, if the risks are too high, can not form scale and achieve long-term development. After the battery ages, how does the performance change, and is there a possibility of sudden change in safety? To what extent is aging, and how big is the risk? Answers to some key technical questions will be decisive for industry development.
Recent articles have focused on aging issues. The following are mainly translated from "French explosions and thermal runaways during external heating abuse of commercial lithium-ion graphite-LiCoO2 cells at different levels of ageing" by Fredrik Larsson et al. The paper was published at the end of 2017 Power Magazine.
Regarding the paper, the experimental phenomenon is described in great detail, but the logic is not strong. You can pay attention to the specific phenomenon of battery temperature, voltage and exhaust before thermal runaway. I believe that there are some references for establishing a monitoring and predicting thermal runaway safety system. After all, not everyone has the opportunity to conduct such tests by hand.
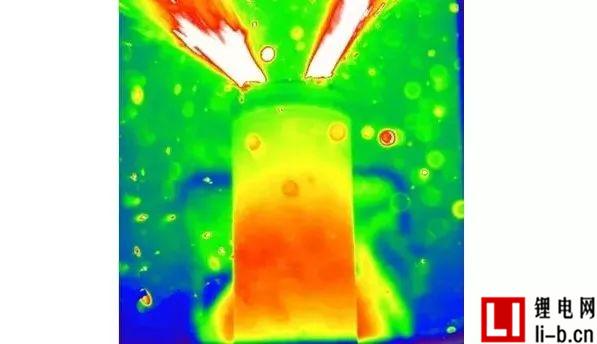
Still come to the conclusion first:
The square LiCoO2 - graphite battery, with a nominal capacity of 6.8 Ah, is externally heated in the oven. The study included cycle-aged cells, non-circulating cells stored at 60 ° C and non-circulating cells stored at room temperature. Work and non-working (failed) cells were studied.
When heated externally, all batteries generate thermal runaway, releasing smoke and gas. For about half of the working cells, within about 15 seconds after thermal runaway, the gas accumulated in the oven is ignited causing the gas to explode with the main smoke release process.
Regardless of whether or not the cells have been circulated, they do not affect the occurrence of gas explosions, they occur at all cycle aging levels of 0-300 full-depth cycles.
The gas was analyzed using FTIR. The presence of HF gas is detected whether or not a flame is present.
Another HF precursor, POF3, which releases potentially toxic gases, is also detected simultaneously with HF. In addition, a harmful gas CO was detected. The thermal runaway temperature is approximately 190 ° C and shows a weak correlation with the number of cycles during aging, between 0 and 200 cycles, between 100 and 200 cycles, producing the least toxic gases. Aging stage.
Three failed cells were tested, one of which had a sudden failure in the cycle after 229 cycles, and two cells that were not cycled but were stored at 60 ° C for 10 months also failed. The failed cells also enter a thermal runaway state; however, they respond significantly to the increase in thermal runaway temperature and the rate of temperature increase. These batteries have no sparks, burns or gas explosions.
1 Introduction
Compared with other types of batteries, lithium-ion batteries generate more heat, and their gas emissions, explosions, and fires are more risky. These risks are still far from being fully understood, and research and accident analysis are likely to improve system security. The type and severity of the risk depends on the size of the application and battery system. Due to the spreadability of battery and module failures, as the size of the battery system increases, the consequences of the failure may increase significantly.
Lithium-ion battery pack with three portions of all the necessary fire triangle; heat / igniter, combustible and oxygen. In addition, once overheated, typically starting from 70 ° C to 120 ° C, the lithium battery begins to swell and is capable of releasing gas (exhaust). The exhausted gases are flammable and toxic. If the temperature is high enough to reach 150 ° C ~ 200 ° C, the battery self-heating into the acceleration phase, thermal runaway (TR) may occur. The term thermal runaway initiation temperature refers to the temperature at which the exothermic reaction begins and ultimately causes thermal runaway, while the thermal runaway temperature refers to a very rapid temperature rise of thermal runaway. Thermal runaway is usually accompanied by a large amount of flue gas release, which may be accompanied by damage to the battery box, burning or gas explosion. There are therefore two main types of explosions in the thermal runaway process: explosion of the battery casing and gas explosion of combustible exhaust gases mixed with air. Cylindrical and rigid square batteries produce high internal pressure and are therefore designed to release gas through a built-in battery safety valve, but if the exhaust fails, extreme pressure can be generated inside the battery, causing the battery case to explode. There are two types of explosions, one is the explosion inside the battery, and the other is the explosion caused by the delayed ignition of the mixed gas of combustible gas and air accumulated in the closed or semi-closed casing. The consequences of a flammable gas explosion may be much more severe than the consequences of a battery explosion.
The vented gas may contain products formed by evaporation and decomposition of the solvent, such as CO, CO2, H2, CH4. In addition to CO, a large number of different toxic compounds, including fluoride gases, can be released. Hydrogen fluoride (HF) has attracted the most attention and is a very toxic gas. Few published studies have reported the amount of HF released during commercial lithium ion battery abuse and the amount of HF released by electrolyte combustion. The fluorine in the battery is derived from a lithium salt such as LiPF 6, but also from electrode binders such as PVdF, electrode materials and coatings such as fluorophosphate and AlF3 cathode coatings, and fluorine-containing additives such as flame retardants. Battery safety is very complex and the overall view is very important. For example, by introducing an AlF3 coating, the risk of thermal runaway can be reduced, while the risk of toxic fluoride gas emissions and gas explosions may increase. Overall safety is therefore difficult to assess, depending on the size and condition of the battery, and improvements to one parameter may actually degrade overall safety.
There are many different types of abuse tests, and the usual one is external heating. There are several types of external heating methods suitable for use in lithium batteries, such as heating in an oven, heating by IR radiation, heating a film or other heater, using a heating rate calorimeter (ARC) or other type of instrument in a closed chamber. So far, there have been many studies on new batteries, but few studies have examined the effects of aging on safety. The performance of the component may change during the aging process, but the actual requirement is that it requires a high level of battery safety throughout the life of the battery. Aging usually occurs in the form of calendar and cycle aging. In order to shorten the test time, the storage and recycling of the cells is usually carried out at elevated temperatures, for example 35 - 55 ° C, but the measurements at these temperatures are not the same as those obtained when used at ambient temperature. It is exactly the same, for example 20 ° C, because other decomposition reactions may occur. The aging process of lithium ion batteries is non-linear and complex and has not been fully understood. For example, during aging, the solid electrolyte interface (SEI) layer changes, and SEI plays an important role in the early stages of thermal runaway. Studies have used calorimetry to describe the evolution of SEI, using XRD, XPS, SEM and Raman spectroscopy to analyze the surface, describing the three major stages of thermal runaway.
A test was conducted to study the thermal stability of the calendar aged aging 18650 battery through the ARC test . It was found that the aging cell began to emit heat up to 70 ° C, indicating that the aging cell showed a higher exothermic onset temperature.
In addition, 0.75 Ah non-commercial graphite/lithium cobalt oxide (LCO) lithium ion batteries after 10 and 200 cycles were studied, and it was found that the thermal safety was reduced after 200 cycles in the acupuncture abuse test.
A 2 Ah graphite/LMO-NMC Li ion 18650 battery stored at 60 ° C for 36 weeks was investigated. The ARC test found that the exothermic reaction and thermal runaway onset temperature of the 36-week old cell were lower.
In contrast, another 4.6 Ah graphite/LMO lithium ion battery stored at 55 ° C for 10 to 90 days was found to have an increase in the onset temperature of self-heating and thermal runaway with increasing aging.
In another experiment, the effect of 1.5 Ah graphite/LMO-NMC high-power Li-ion 18650 battery on the thermal response of cycle aging in the ARC test was investigated. It was found that the first exothermic response and the onset temperature of thermal runaway were significantly reduced. The temperature was as low as 30.7 ° C, and lithium plating was also observed on the anode of the 1 C cycle battery at -10 °C.
A group of people studied the safety of graphite/NMC 18650 new and recycled aged cells using the 1C ARC test at 0 °C to 70% health (SOH). Aging cells have reduced thermal safety with self-heating onset temperatures as low as 30 °C and earlier thermal runaway. The same authors also studied safety through acupuncture abuse tests and found that aged cells have delayed but more severe thermal runaway. In general, low-temperature cyclic anode plating and charging with excessive current will increase the risk of lithium-ion batteries.
In the work involved in this study, the safety of lithium-ion cells with uncirculated cells stored at 20 ° C and 60 ° C and 100, 200 or 300 C/2 deep cycle cells was studied. The same type, a commercial 6.8 Ah graphite / LiCoO 2 lithium-ion battery. Safety was assessed by an abuse test in the form of an external heating (oven) while performing FTIR gas measurements. Conduct an ARC test to compare safety assessment methods.
2 test
2.1 Test cells
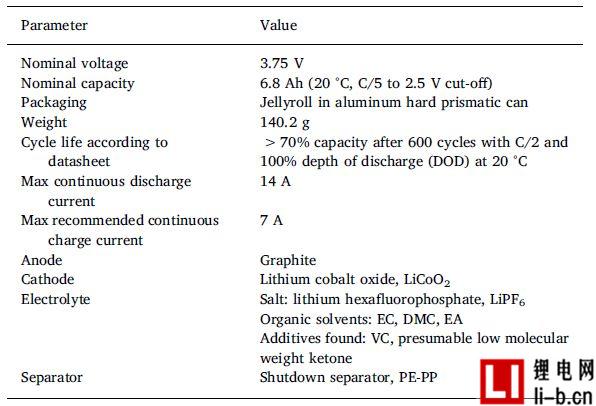
These batteries were all from the same commercial lithium-ion battery with nominal capacity and voltage of 6.8 Ah and 3.75 V, LCO cathode, graphite anode, polymer separator and square appearance, see Table 1 for detailed cell parameters. Due to the presence of LiPF6 salts in the electrolyte , the battery contains fluorine, but other parts of the battery may also contain fluorine, see the examples in the introduction. It should be noted that this test did not analyze other potential sources of fluorine in the cell.
2.2 Electrical characteristics
A four-wire electrochemical impedance spectroscopy (EIS) test with a frequency range of 100 kHz - 5 mHz, a 60-point logarithmic distribution, and an amplitude of 0.1 A was performed in a constant current mode using Metrohm Autolab PGSTAT302N and Metrohm Nova v1.11 software.
Table 1, commercial Li-ion battery data sheets, cell specifications, TG-FTIR electrolyte analysis and separators from DSC analysis. The battery is at ambient temperature, about 20 ° C, in a Faraday cage. The sensor and current measurement cables are twisted and separated in opposite circles to minimize interference.
Measure the capacity of each battery using a multi-channel Digatron battery tester or Metrohm Autolab with a Booster 20 A module. The battery capacity measurement uses a voltage limit of 2.50V and 4.20V, a current of 1.4A (about C/5), and a cut-off charging current of 0.05A. After the first charge, three complete discharge-charge cycles were applied. Prior to aging, the discharge capacity was measured with the first of three cycles, and after aging, the discharge capacity of the third cycle was used to determine the battery capacity.
Before the EIS measurement, the battery was fully charged as a "first charge" (100% SOC). The number of cycles described herein does not include three charge and discharge cycles for measuring battery capacity.
2.3 Aging procedure
2.3.1 Cyclic aging
The cells were individually cycled using a Digatron battery tester with a 100% depth of discharge (DOD) between 4.20V and 2.50V. A current of 3.4 A (C/2) was used for charging and discharging, and the charging cut-off condition was a charging current of 0.34 A (C/20). These cells were forced to convectively cool at ambient temperatures of 21 °C. Each battery has a temperature sensor mounted on the largest side.
2.3.2 Temperature aging
The fully charged battery was stored in an oven at 60 ° C for 10 months, which is the maximum allowable storage temperature obtained from the battery manufacturer's data sheet. The cells were stored in a 20 ° C environment before and after storage at 60 °C.
2.3.3 Complete battery aging process
First, the cells were left unused in a shipping box at room temperature, about 20 ° C for 12 months. Second, the battery went through the first charge and measured the capacity and impedance of each battery. Third, the battery cycle selected for cyclic aging is approximately two months (300 cycles). Fourth, measure capacity and impedance and store the cells at room temperature. Fifth, some non-circulating cells were stored in an oven at 60 ° C for 10 months.
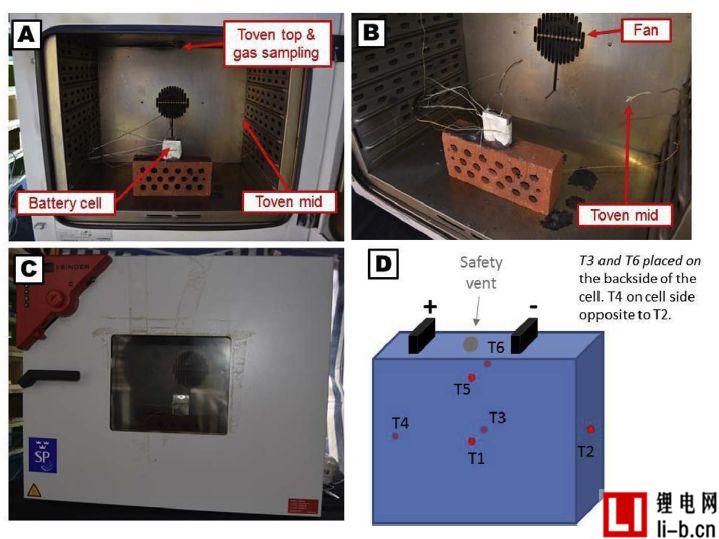
Figure 1. Photo (AB) shows the battery placed in the oven, photo (C) shows the closed oven, the battery can be seen through the glass window of the oven door, and the schematic (D) shows the placement of six thermocouples on the battery The position on the surface.
The external heating abuse test was conducted approximately 2 years and 4 months after the date of manufacture. Therefore, all cells have the same long calendar age, but during their lifetime, some cells have been cycled, while others have been stored at 60 ° C for a period of time (10 days for 28 months).
2.4 External heating abuse test
2.4.1 General Settings
A total of 14 external heating abuse tests were performed. The battery was individually heated using a thermostatically controlled oven Binder FED 115 with a 115 L internal volume. The battery was centered inside the oven and mechanically fixed to the brick with steel wire (0.8 mm diameter), see Figure 1. One minute after the start of the test, the oven was adjusted to the maximum heating rate and the temperature was set to 300 °C. The total test time varies due to changes in environmental conditions and eventual gas explosion.
The oven is custom made with four 50 mm diameter vent ports sealed with a silicon plug and equipped with an internal fan set to maximum speed to homogenize the internal temperature. The vents placed on the back of the oven are set to close completely. However, this is not a perfect seal and it is partially deformed during the abuse test. In the first test, the oven door was normally closed, but since the door was opened during the gas explosion, the door was taped in the following test. A silicone plug on the top of the oven is loosely mounted and acts as a pressure relief port.
The oven was gently cleaned/cleaned between each test to minimize potential interference from, for example, particle contamination. Glass doors and windows (three-layer glass) are not mechanically broken, but are heavily contaminated and etched, so they are replaced several times to achieve acceptable video quality.
The battery voltage and temperature were measured at 1 Hz using an Agilent 34902A reed multiplexer module. The battery voltage is measured with a K-type thermocouple cable and the cable is screwed into a small bore (0.8 mm diameter) in the electrical connector. The surface temperature of the Li-ion battery was measured using a K-type thermocouple connected with a fiberglass tape (3M, electrical tape Scotch, 19 mm wide), measured at up to six positions T1-T6, see Figure 1D, where T1 - T4 measurements per The center temperature of the side, while the T5-T6 is the additional central sensor on the two largest surfaces. Type K thermocouples are also used to measure ambient temperature (outside the furnace) and furnace temperature, which is measured at two locations, as shown in Figures 1A and B. The test video process is recorded by a camera placed outside the oven door. In some tests, a second camera was also used, placed approximately 2 to 7 meters from the oven. Use a caliper to manually measure the cell thickness (range 150 mm long) and the cell size is recorded in the largest dimension and appears in the center-to-center measurement position.
3 Results and discussion
3.1 Aging - Capacity Attenuation and Impedance
The battery in Test 12 should be cycled to 300 cycles, but failed after 229 cycles during the cycle and could not be recharged or discharged. The batteries in Runs 13 and 14 were initially fully charged and stored at 60 ° C for 10 months, after which the voltage dropped below 1 V. The thickness of these cells increased from 18.5 mm to 21.3 mm (about 15%), but the cell weight did not change, indicating that the cell did not leak or vent. All other cells in this study had a thickness of 18.5 mm before and after cyclic aging.
Table 2 lists the capacity data before and after aging. SOH is the relative remaining capacity, calculated by dividing the current C/5 discharge capacity by the initial C/5 discharge capacity. After cycling, the cells reached the following SOH, about 94% (100 cycles), 91% (200 cycles), and 89% (300 cycles). The end of life (at least for the battery life of the first use) is usually defined as about 70% - 80% SOH, the cell parameter table shows that 600 cycles > 70% SOH (post table 1), therefore, the test electricity The core is far from fully aging. As shown in Table 2, the batteries in Tests 1 and 4 had lower initial discharge capacities because they were cycled 3 times before capacity measurement. However, even though the cells in tests 1 and 4 were cycled 3 times (see the notes in Table 2 for details), they are referred to herein as 0-cycle cells.
Table 2, Battery data of the circulating battery and the non-circulating battery, measured at a discharge capacity of 1.4 A (a C rate of about C/5).
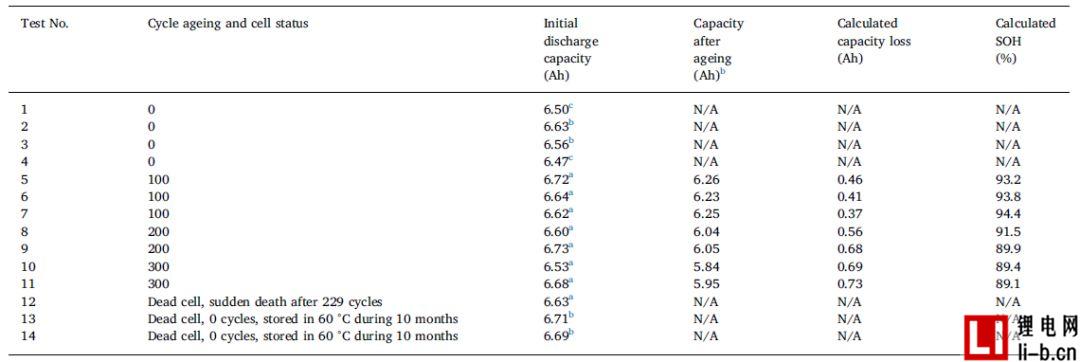
a Use the Digatron Battery Tester.
b Use Metrohm Autolab PGSTAT302N.
c Use Metrohm Autolab PGSTAT302N because the battery was previously charged and discharged 3 times with 3.4 A (C/2) and the charging current was 0.34 A. The effects of these three additional cycles on cycle aging are considered negligible.
Figure 2 shows the impedance measurements of batteries aged at different cycles. Impedance graph, Figure 2A, has the typical appearance of a lithium-ion battery, including high-frequency inductors, overlapping semi-circles with suppressed intermediate and low-frequency spikes, corresponding to cell internal resistance and connection impedance, SEI impedance, charge transfer effects, and mass transfer impedance . The intersection of the complex impedance and the real axis determines the average series impedance, as shown in Figure 2A, which is the internal resistance of this type of cell. The new cell is 13.2mΩ, which increases by 14.4mΩ after 300 cycles (grows 9 %). Figure 2B is a graph of phase angle versus frequency log. Two peaks can be found in this picture, one above 0.1 Hz and one at around 2 Hz. The low frequency peak increases with cycle aging, while the second peak has more or less disappeared after several cycles. In any case, after 3 cycles, significant differences were detected, so that the phase angle provided a new perspective to observe the effects of aging. For aged batteries (graphite/LCO) with the same electrode chemistry, the low frequency semicircle in the impedance map is considered to be oxidation of the electrolyte at the cathode, thus may indicate that the peak growth in the phase angle above 0.1 Hz is also due in this case Oxidation at the cathode. This may be because the battery is charged to a relatively high 4.20V cutoff voltage, although still within the battery manufacturer's determined parameters.
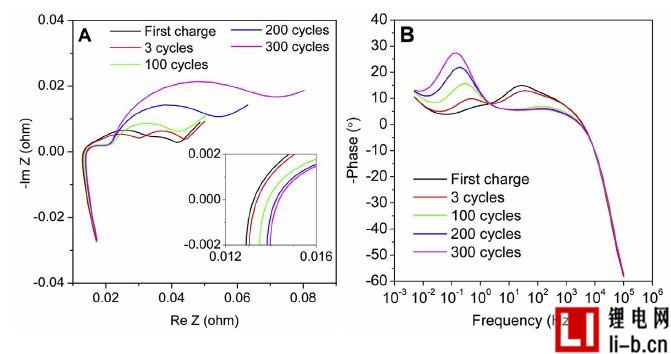
Figure 2. (A) Complex impedance in a battery with different cycle times between 100 kHz and 5 mHz at 100% SOC, with complex impedance between the real and imaginary parts of the insertion around the origin, and (B) The phase angle is plotted against the frequency. Calculate the average of each cycle of all available cells, excluding the initial "3 cycles" of the measurement, of which only one cell measures this parameter.
3.2 External heating abuse
In Runs 1-11, the cells were fully charged (100% SOC) and the cells experienced different numbers of aging cycles ranging from 0 to 300 cycles. The cells of tests 12-14 are failed cells, so the SOC is undetermined. The battery in Test 12 "suddenly died" during the cycle after 229 cycles. The cells used in Runs 13-14 have been stored at 60 ° C for 10 months, during which self-discharge or failure, and thus one cell OCV is less than 1V, ie below 0% SOC level.
3.2.1 Overview results
Table 3 lists the external abuse test results for 14 different aging state cells, working cells, and failed cells. In all tests, when the temperature reached the thermal runaway temperature, the rate of temperature rise increased rapidly and all batteries experienced thermal runaway. For tests 1 - 11, after the thermal runaway of the battery, there are short (less than one second) and typical combustion, spark and jet, an example is shown in Figure 3. In some cases, the cells burn for longer periods of time and larger flames depending on the different stages of the "fire", as shown in Table 3. Normally, the situation of subsequent fires is small, as shown in Table 3, which indicates that one or several flames existed in a long period of time. Further, the term "no open flame" is used to mean that the battery or its gas is not ignited. This does not take into account the initial short-circuit/sparks and so on. The term "gas explosion" refers to a delayed ignition of the accumulated combustible gas released from the battery mixed with the air in the furnace, which in the present case results in a pressure wave that forces the furnace door to open. Gas explosions are a common phenomenon in combustion, but lithium-ion battery fires are not often discussed. In this study, as shown in Table 3, all working cell tests were performed after a non-combustion or gas explosion. In addition, for about half of the working cells and all of the aged cells, the gas explosion occurs approximately 30 seconds after the combustion, followed by a small fire or spark of 20-50 seconds. For failed cells, tests 12–14 show significantly different results, and video analysis does not show any sparks, jets, or gas explosions.
Table 3 summarizes the results from the external heating abuse test.
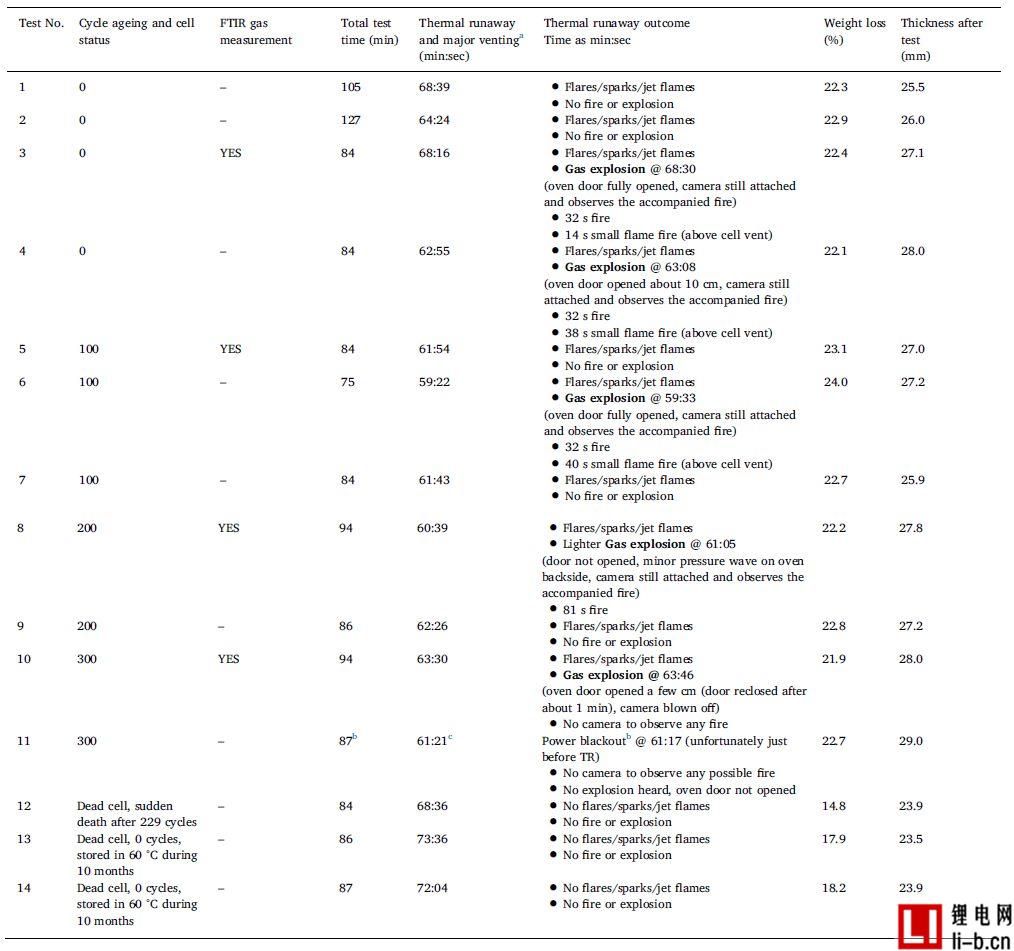
a The main gas discharge occurs almost simultaneously with the arrival of the thermal runaway temperature, which rapidly increases the temperature rate.
b Test equipment, data logging, oven camera and externally heated power supply are out of power for approximately 9 minutes (no data recorded in 9 minutes and 39 seconds). The secondary camera outside the oven is primarily used to observe the main gas emission process and is used for the time assumed to be TR and still working (powered by the laptop battery pack).
c Determined by an auxiliary camera outside the oven.
For all tests, video analysis showed that while the thermal runaway temperature was reached, the battery safety valve at the top of the cell opened and released a large amount of smoke, filling the oven space quickly. The color of the released smoke is usually white or light gray. If the battery safety valve does not open, for example due to a malfunction or poor design, a battery housing explosion may occur, which is a dangerous situation, including the risk of squirting the casing debris. It just didn't happen in the current set of experiments.
The working cell loses more weight than the failed cell and expands more (thicker). The weight loss of the working cells averaged 22.6%, and the average weight loss of the failed cells was 17.0%. The thickness of the working cell increased from 18.5 mm to an average of 27.2 mm (47% increase), while the average failed cell thickness after external abuse was 23.8 mm. The total test time varies, as shown in Table 3, resulting in different heating times. Some trends can be seen, weight loss and thickness increase are all functions of the number of cycles (the more cycles, the less weight loss, the greater the dimensional expansion). These effects must occur within the shortest internal test time range (75 minutes, test 6).
3.2.2 Temperature results
Table 4 lists the temperature results for the external heating abuse test. The thermal runaway temperature value in Table 4 was determined as the temperature at which a rapid rise in temperature occurred. For operating batteries, the thermal runaway temperature is easy to determine, and for failed cells, especially for test 12, it is less noticeable. The failed cell has a significantly higher thermal runaway temperature, a lower temperature rise rate and a lower peak temperature. 0 cycles of failed cells, a part of their life span at 60 ° C for 10 months, test 13 -14, the test results show high reproducibility. Although the electrode interface must undergo major changes, the failed cell may still contain a large amount of flammable electrolyte. No cells with different SOC levels are studied, so any possible similarity between the low level SOC and the failed cell may be confused in the results.
The battery surface temperature sensors T1-T6 are generally reliable when the thermal runaway temperature is reached. For all tests except test 13 (see note in Table 4), the thermal runaway temperature values were calculated as the average of sensors T1 and T3. Above the thermal runaway temperature, the sensor will record a large temperature drop, which sometimes falls off the battery due to high temperatures, battery expansion and eventual gas explosion. Therefore, another average, Tavg2, is used to determine the maximum average cell surface temperature, the corresponding temperature increase (ΔT) and the length of time (step time Δt). Tavg2 is calculated using all available T1-T6 sensor data, as shown in Table 4. Available sensors are defined as sensors that are not lost in contact with the surface of the cell. The results given in Table 4 naturally vary due to the number and location of available battery temperature sensors. When the distribution of the highest temperature value is wider, the thermal runaway temperature value can be better defined.

Figure 3: Two video images at 59:22 thermal runaway in Run 6, showing a relatively large jet flame (A) and a subsequent smaller flame (B), but none of them ignited the battery or oven a mixture of gases.
Table 4 shows the temperature results of the external heating abuse test, where ΔT is the difference between the maximum Tavg2 and the thermal runaway temperature. Step time, Δt is the reaction time.

a When the power failure occurs, the average battery surface temperature is 188 °C. Thermal runaway occurs after about 5 seconds. The average temperature profile of Test 10 and Test 11 was very good until the power was interrupted.
The bT1 thermocouple failed at the beginning of the test, so instead of calculating the average as T1 and T3, the average is calculated using five temperature sensors T2-T6.
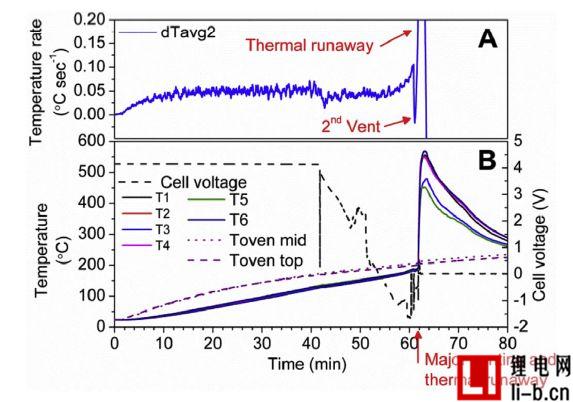
Figure 4. Results of Test 7, (A) showing the average cell surface temperature, dTavg2; (B) showing the battery voltage, temperature measurements T1-T6 from the battery surface temperature sensor, and two temperature sensor measurements in the oven, Top of Toven mid and Toven top.
Before the thermal runaway, the battery surface temperature sensor shows a relatively similar temperature value, and the temperature difference between the sensors after the thermal runaway is large. Figure 4 shows the battery voltage, average temperature and temperature measurements for Test 7, which is one of the few tests that are available for all six temperature sensors throughout the test. The cell surface temperature in Figure 4 varies by about 100 °C. In other tests, the local cell surface temperature changes up to about 300 °C. For this type of measurement, it is important to use multiple cell surface temperature sensors and appropriate verification methods to obtain reliable temperature measurements. The large temperature difference across the cell surface can be explained by the anisotropy of the heat transfer process, rapid and substantial heat generation, and the effects of exhaust and flame from the reaction. During thermal runaway, internal battery heating may create the highest temperature near the center of the battery. There is a large difference in the in-plane heat transfer between the cells and the heat transfer between the planes (anisotropic heat conduction).
The thermal properties (eg, thermal conductivity, specific heat capacity, density) of each material are different due to temperature changes caused by phase changes (eg, membrane melting) and mass loss (eg, exhaust, flame). The tested battery has an aluminum casing with high thermal conductivity but a large temperature difference. For other types of battery housings, such as soft pack batteries , there may be a greater temperature distribution.
Figure 5A shows the average cell surface temperature before and during the early stages of thermal runaway, and all tests are synchronized with the thermal runaway temperature time. In the few minutes before the thermal runaway of some curves, the temperature will drop for a few minutes, especially for the blue line (100 cycles), which is supposed to be due to the temperature drop caused by gas release. Is the second exhaust process. Figure 5B shows the relationship between the thermal runaway temperature value of the working cell and the number of aging cycles, showing a minimum between 100 and 200 cycles. The figure also shows the weight loss and thickness after testing versus the number of cycles. In Test 11, a total power outage occurred at the test site a few seconds before the thermal runaway. In any event, the primary exhaust time in Test 11 can be determined by a camera operating externally. The last recorded data point points to 188 ° C, and the time between the observed gas release and its corresponding thermal runaway is about 5 s. Despite the short time, the battery temperature rises relatively quickly. The temperature heating curves of Run 10 and Test 11 were very consistent until power failure.
The thermal runaway temperature value presented herein refers to the last temperature point before the rapid temperature rise begins, as shown in Figure 5A. The thermal runaway temperature values given here are approximately 190 ° C for the working cell and between 201 and 205 ° C for the failed cell. Similar temperature values have been reported earlier.
If external heating stops sometime before the thermal runaway temperature, the battery will still enter a thermal runaway state based on battery temperature, the battery's own heating rate, and environmental conditions such as battery cooling rate. However, the experimental method used in this work did not use a method of suspending the heating step. Another common method used in the field of lithium-ion battery safety is the ARC test of the Heat Waiting Search (HWS) program, in which the cell is heated with a high sensitivity heater, if the exotherm is suspended, and under adiabatic conditions, the cell is detected. Exothermic phenomenon.
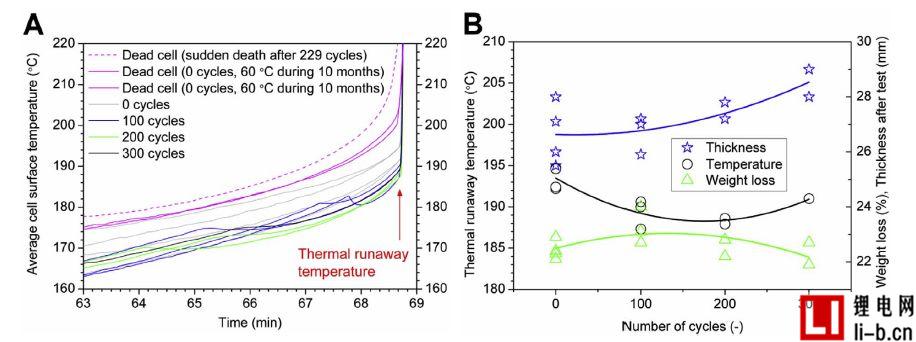
Figure 5. Average cell surface temperature calculated from the average of sensors T1 and T3, showing (A) temperature versus time for all tests (time scale has been synchronized with rapid temperature rise at thermal runaway temperature, using test 1 Time is used as the reference time); (B) indicates the thermal runaway temperature, cell weight loss, cell thickness, and cell cycle number of all working cells (three curves are the results of the second-order polynomial fitting of each type of data) .
For the ARC measurement of the thermal runaway onset temperature, it can be defined as the self-heating temperature rise rate (SHR) > 0.2 ° C per minute; the definition of the thermal runaway temperature rise rate is SHR > 10 ° C per minute.
The heating time in ARC is usually very long, which allows for boiling/exhaustion and potential side reactions at high temperatures, such as SEI and electrode material breakage and electrolyte degradation, which can affect test results if the battery heats up faster. Assuming that the electrolyte has sufficient time to boil/exhaust at a lower temperature, thermal runaway does not occur at higher temperatures because there is no electrolyte electrode reaction and thermal runaway is unlikely. The heating test time used herein is approximately 60 minutes, also providing time for side reactions and electrolyte boiling/exhausting, but is shorter in time than the ARC test method. In comparison, in the ARC test at the National University of Singapore, batteries from the same batch of 100% SOC were externally abused. If the thermal runaway temperature is determined by ARC measurement in a manner similar to that used in oven experiments, the result is approximately 140 °C. The results of the two measurements deviated by approximately 50 °C. Therefore, the thermal runaway temperature value of the same type of battery depends on the test method and its definition, as well as the location, quantity and quality of the temperature sensor used. It is important to understand this when comparing the thermal runaway temperature or initial temperature values of different studies.
The minimum observed thermal runaway temperature, Figure 5B reflects the findings of Wu et al. They reported similar tests after 200 cycles (approximately <87% SOH) and the thermal stability of aged lithium-ion batteries was reduced. In this case, scanning calorimetry (DSC) analysis of the electrode showed that a part of the lithium content in the cathode was irreversibly transferred to the anode by aging, thereby forming an SEI layer obtained by reacting with the electrolyte. For 300 cycles, we observed that the reaction was not too intense in terms of thermal runaway and maximum temperature, which was associated with a small decrease in energy storage capacity.
In Figure 5B, it was observed at the end of the test that the cell showed a reasonable thickening. During the thermal runaway process, the battery case is inelastically deformed, which increases as the number of cycles increases. An increase in the thickness of the cell observed in the failed cell prior to heating indicates that irreversible deformation and thickening may occur before the exhaust in all cases.
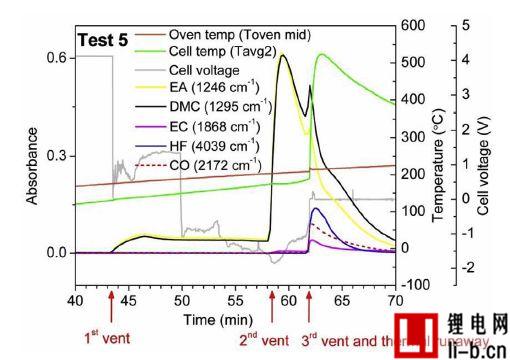
Figure 6. Measurement of battery voltage and gas emissions for 100 cycles of cell 5 of test 5. Three separate exhaust stage exhausts and thermal runaway occurrences are marked with arrows.
3.2.3 Results combined with gas measurement
Figure 6 shows the measurement of temperature, battery voltage, and gas emissions for Test 5, which is a battery that ages 100 cycles. Three exhaust processes were detected. When the battery voltage drops to approximately 0V, the first venting process releases dimethyl carbonate (DMC) and ethyl acetate (EA) vapor. The battery voltage drops and the process begins when the surface temperature is about 130 °C. Two commercially available membranes, a PP single layer and a three layer closable membrane PP / PE / PP and DSC measurements on the separator extracted from non-abuse batteries are shown. This temperature is very close to the first melting temperature at which the cell closes the pores of the membrane. Due to the melting of the diaphragm, it is expected that the temperature will show a certain degree of decline, because the process is endothermic, but in reality, within 12 seconds, the cell surface temperature measurement clearly shows a small temperature rise. One possible explanation for the observed increase in temperature is that the battery experiences a short circuit in the internal battery to generate heat, however the short circuit should only occur if both diaphragms of the diaphragm lose their insulating function (melting). At 3.5 minutes before the thermal runaway, a second exhaust phase occurs, also releasing ethylene carbonate (EC), which is significantly reduced during the venting due to the cooling effect of the overflow gas. The characteristics of the first and second exhaust stages were not seen or heard in the video and were determined only by FTIR gas measurements.
Table 5 shows the flammability data of the electrolyte solvent in the battery.

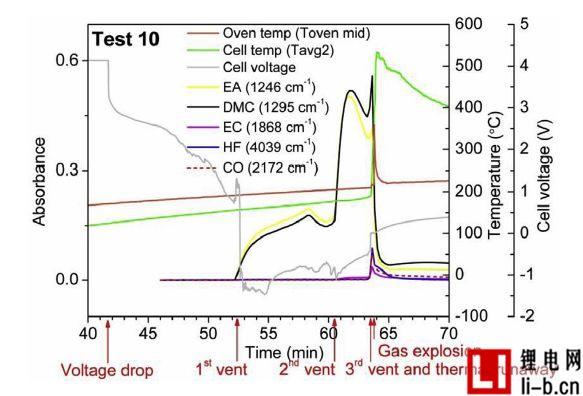
Figure 7. Test 10, temperature measurements of cell cores, cell voltages, and gas emissions over 300 cycles. Due to the explosion, the camera malfunctioned, so no camera observed the flame. Due to the explosion, the oven door opened and the gas emissions dropped rapidly.
3.2.4 Gas explosion
For non-failed batteries, gas explosions are relatively common, ie, 5 explosions occurred in 11 tests and occurred in the cycle aging stages (0 - 300 cycles) within the range studied. In trials 3, 4, 6 and 10, the oven door was opened and the camera was blown and heard a loud bang when the gas in the oven ignited. For the gas explosion in Test 8, the gas ignited, but the development was different and the power was small. In Experiment 8, the total departure time was 26 s from the start of thermal runaway to exhaust to ignition. In the other four test cases, after a thermal runaway, a gas explosion occurred after 11-16 seconds (average 13.5 seconds). If the oven is completely sealed and there is no pressure to release the gas, the explosion may be more severe.
Regarding the relationship between the number of cycles and the gas explosion, the overall trend is that all gas explosion tests are not related to cycle aging, but the cells with the highest temperature rise rate are prone to gas explosion, with a maximum range of 25 and 72 ° C sec. Between -1, see Table 4 and Figure S4.
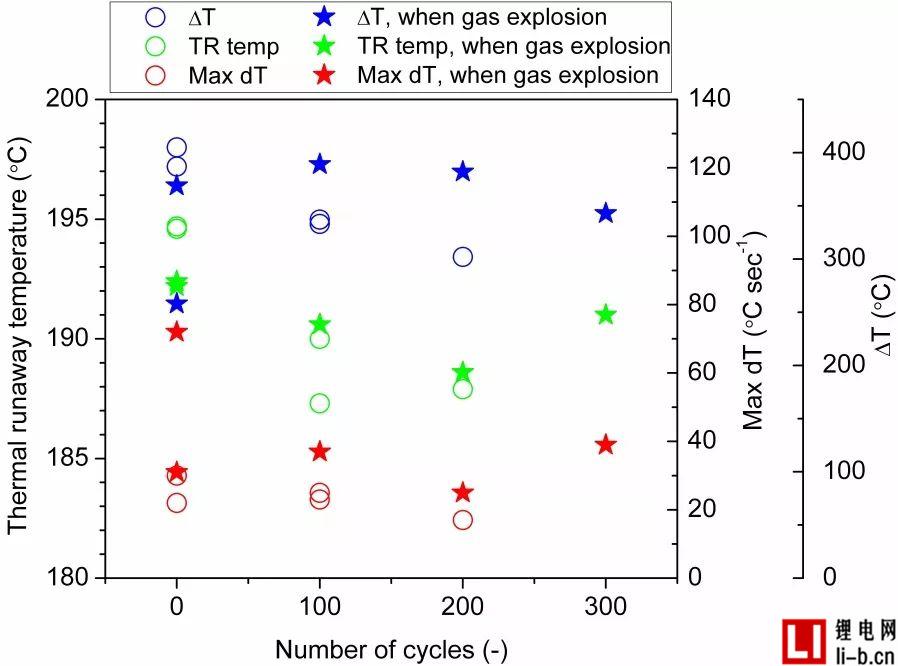
Fig. S4. Thermal runaway temperature, maximum temperature rise rate (maximum dTavg2) and temperature rise of non-failed cells relative to cycle life (number of cycles), the position of the asterisk is exhausted.
Cyclic aging for up to 300 cycles results in a capacity reduction of approximately 90% (90% SOH) and an increase in impedance (series resistance) of up to approximately 10%. The increase in electrical resistance may be related to the formation of SEI, and the thickness, morphology and composition of the SEI affect the heat generated in the early stages of thermal runaway.
The formation of Li-metal (Li-plated layer) at the electrode due to the cycle is considered to be secondary because the cycle is performed at room temperature and there is no extreme large current. If there is a Li plating effect on the thermal runaway, it may be related to the thermal reaction of the lithiated graphite anode with the electrolyte, which is related to the test mode of external heating abuse.
From the analysis in the video, it can be seen that all non-failed cells, tested 1-11, produce visible flames and sparks. Even if the oven is full of gas, there is no gas injection until an open flame ignites. In the event of an explosion, the mixture of gas and air must be within a certain range and an ignition source must be present. These standards may not have been reached in the first approximately 10 seconds of battery gas emissions during the third exhaust phase. After the third gas exhausted flue gas filled the oven for about 2-3 seconds, it was not possible to clearly determine whether there was a spark in the video due to low visibility in the smoke. Before the third exhaust or thermal runaway, the FTIR detected that the oven was filled with the gas emitted by the first and second exhausts of the cell. Therefore, most of the combustion occurs in the third exhaust phase, and the battery safety valve has a flame spray.
For all 0, 100 and 200 cycle batteries, if the battery experiences a gas explosion, the battery thickness expands more; for 300 cycles, the opposite is true. In fact, thicker cells involving gas explosions may indicate that these cells do create higher pressures and temperatures within the cell before the safety valve is fully opened (see Figure S4).
The ignition source may start inside or outside the battery. The ignition source for a gas explosion may be due to an unobserved spark or a spark caused by thermal runaway, or an internal battery short circuit due to melting of the separator, or just spontaneous combustion of the hot gas mixture. The battery surface temperature of all working batteries is at least above 465 ° C, and therefore higher than the auto-ignition temperatures of EA, DMC and EC, see Table 5. Gas explosions may be caused by ignition of other released battery gas products such as CO and H 2 . CO release was observed in the third exhaust. The intensity of the CO band is relatively low compared to the solvent, and there is no difference in strength with and without gas explosion. In addition, the internal temperature of the battery may be higher than the measured surface temperature. The battery may contain a flame retardant in the electrolyte. This may explain why no battery is ignited instantaneously and not all tests burn.
Table 5 shows the flammability data for EA, DMC and EC. The autoignition temperature is the lowest temperature at which a flammable mixture of solvents can spontaneously ignite. The flash point is the lowest temperature at which the ignition source can ignite the liquid. Within the flammability range, between the lower and higher flammability limits, the gas mixture can be ignited and cause the gas to explode. When the flammable mixture is ignited, the gas volume is usually increased by 5 - 8 times due to the temperature rise, i.e., it causes an overpressure of 5-8 bar (1 bar = 0.1 MPa). Please note that many building structures, such as doors and windows, can withstand a pressure difference of less than 100 mbar. A flammable mixture can be formed with only a small amount of electrolyte. In one cubic meter, about 30 L (3% by mole of 1 m 3 ) of solvent is required. Using the ideal gas law and normal temperature and normal pressure, it can be concluded that 30 L corresponds to about 100 g of solvent. This means that a solvent of 1 kilogram of electrolyte, corresponding to a capacity of about 350 Ah, can produce a flammable mixture of 10 m 3 .
For a 115 liter volume oven, 100 grams/m^3 of gas corresponding to about 12 grams (8% of cell weight) of electrolyte gas released will result in the lowest flammability limit (LFL) in the oven. The weight of the working cell is reduced by 31 to 34 grams, while the failed cell loses 21-26 g. During the exhaust process, the jet is composed of a variety of cell materials, such as electrolyte, diaphragm, etc. LFLs may be easily reached in all tests, but not all tests have sparks/explosions. It is important to consider that due to the non-ideal behavior of the gas and gas mixture, the LFL may vary in each state and the gas concentration will vary somewhat within the oven volume. In addition, at increasingly higher temperatures, rapid expansion of the furnace gas may create an oxygen-poor environment that changes the ignition conditions.
3.2.5 Toxic gas emissions
Gas emissions of CO, HF and POF3 were measured in all four tests, whether or not FTIR gas measurements were taken. CO is a suffocating gas. HF is very toxic, and POF3 can be considered as a precursor of HF by hydrolysis and can therefore also be considered toxic. According to Yang et al., there are many sources of fluoride, but the main source of fluoride is usually HF and POF3 which produce lithium salt LiPF6.

It can be seen from the equation. In (2) and (3), water or moisture is required to generate HF. The interior of the battery, such as an electrolyte, may contain very small traces of water, but they usually disappear in the first cycle of the cell by causing the formation of the SEI layer. Under normal conditions, the temperature increases at a moderate rate and the battery is still completely sealed. When the battery seal breaks, the first gas is emitted and the air in the oven contains moisture. However, in the first and second exhausts, HF and POF3 have not been detected. The opening of the battery safety valve is at the third vent and this is the only vent that detects HF and POF3. This is an interesting question, why is HF and POF3 only detected in the third exhaust?
In the third exhaust, instead of the first or second exhaust that is also open in the cell. The possible reason is that in the first and second exhaust gases, the electrolyte solvent boils and is discharged as a single compound without the Li salt. In the third exhaust, the gas release is very strong, as can be clearly seen from the video, it not only releases the most volatile part of the electrolyte, but also releases the remaining electrolyte, including part of the LiPF6. Thereafter, the LiPF6-containing electrolyte can react with moisture in the oven and produce HF and POF3. Temperature also affects the formation of HF, but the temperature difference between the three vents is relatively small.
3.2.6 Gas detection
The gas released by lithium-ion batteries is toxic and flammable. If the gas is not ignited immediately when it is ejected, but a mixture of flammable gas and air and after a period of time, it is dangerous to ignite by an element such as a heat battery cell. If the gas is limited by the battery system cabinet or the external mounting box, this will result in a severe gas explosion.
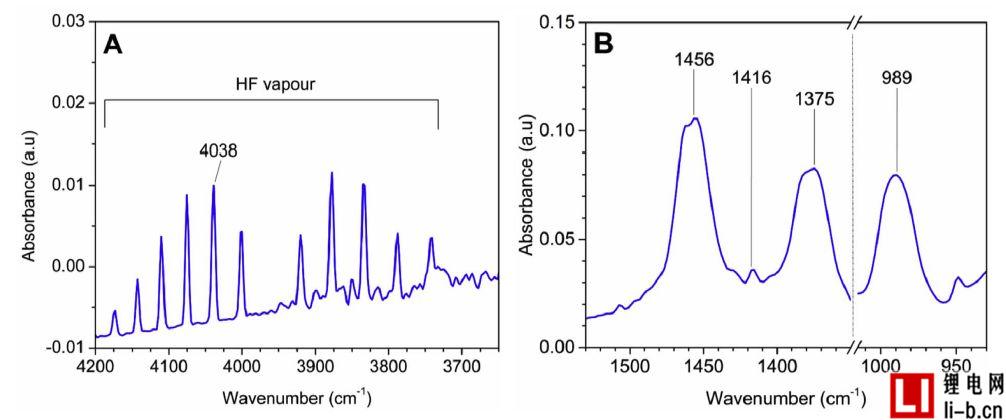
Figure 8. FTIR measurements in Test 5, (A) shows HF emission at time 79.6 minutes; (B) shows POF3 emission at time 61.8 minutes.
Especially for large lithium-ion battery systems, the ability to collect gaseous emissions and vent them in a safe manner is an important safety measure. If gas sensors are used, they may detect hydrocarbon levels and the risk of gas explosion. Gas sensors can also be used to detect toxic gases such as HF sensors. It may therefore be necessary to use multiple dynamic gas sensors to detect early cell venting. The first and second exhaust processes detected in this test have no image and sound phenomena and are therefore not easily detected without a gas sensor. However, a battery equipped with six battery surface temperature sensors showed a temperature drop when the gas was released for the second time. The characteristics of the first exhaust gas were not clearly seen in the temperature data, but the presence of the exhaust phenomenon was found from the voltage drop to 0V.
In Figure 5A, the second exhaust, it is quite clear that only a few minutes before the thermal runaway, the average cell surface temperature suddenly drops. The temperature change of the second exhaust gas is also clearly shown in Figure 4, and dTavg2 drops rapidly before the thermal runaway temperature increases very rapidly. A sufficient number of battery surface temperature sensors in the battery pack can predict and detect large amounts of gas release. Today's battery packs usually do not have a temperature sensor for each battery. Instead, for example, each battery module uses two temperature sensors (for example, 20 battery cells). In short, there is no universal standard. This type of sensing can vary widely, so that using battery cell surface temperature measurements as a gas detection alarm often does not work unless there is a direct contact temperature sensor on the failed battery.
When the battery safety valve is opened, a large amount of smoke and gas are released, which is easy to see visually. Battery systems typically have a high degree of sealing, such as IP67, which can hinder gas release and visual inspection, and may increase the risk of gas explosion when the gas is eventually released. In the absence of detection of exhaust gases, it is impossible to speculate that there is a risk of explosive gas explosion. The released flammable gas accumulates inside the battery, and only one ignition source will explode. A situation like this can be detected by a gas sensor installed in the battery case. A battery system with a strategically planned temperature detection system provides early gas emissions monitoring.
4 Conclusion
The square LiCoO2-graphite battery has a nominal capacity of 6.8 Ah and is abused by external heating in the oven. The study included cycle-aged cells, non-circulating cells stored at 60 ° C and non-circulating cells stored at room temperature. Work and non-working (failed) cells were studied.
When heated externally, all batteries generate thermal runaway, releasing smoke and gas. For about half of the working cells, within about 15 seconds after thermal runaway, the gas accumulated in the oven is ignited causing the gas to explode with the main smoke release process.
Regardless of whether or not the cells have been circulated, they do not affect the occurrence of gas explosions, they occur at all cycle aging levels of 0-300 full-depth cycles.
The gas was analyzed using FTIR. Gas emissions are detected whether or not toxic hydrofluoric acid is used. Therefore, the HF does not require a flame, and there is indeed HF after the presence of the flame. No factors affecting the rate of HF production rate were studied.
The other releases a potentially toxic gas and HF precursor POF3, which is also detected simultaneously with HF. The harmful gas CO is also detected in the third exhaust stage. The thermal runaway temperature is approximately 190 ° C and shows a weak correlation with the number of cycles during aging, between 0 and 200 cycles, between 100 and 200 cycles, producing the least toxic gases. Aging stage.
Three failed cells were tested, one of which experienced a sudden failure of the rabbit in the cycle after 229 cycles, and two cells that were not cycled but were stored at 60 ° C for 10 months also failed. The failed cells also enter a thermal runaway state; however, they respond significantly to the increase in thermal runaway temperature and the rate of temperature increase. These batteries did not emit sparks and there was no burning or gas explosion.
Original reference of the paper:




 在线地图
在线地图 收藏本站
收藏本站


